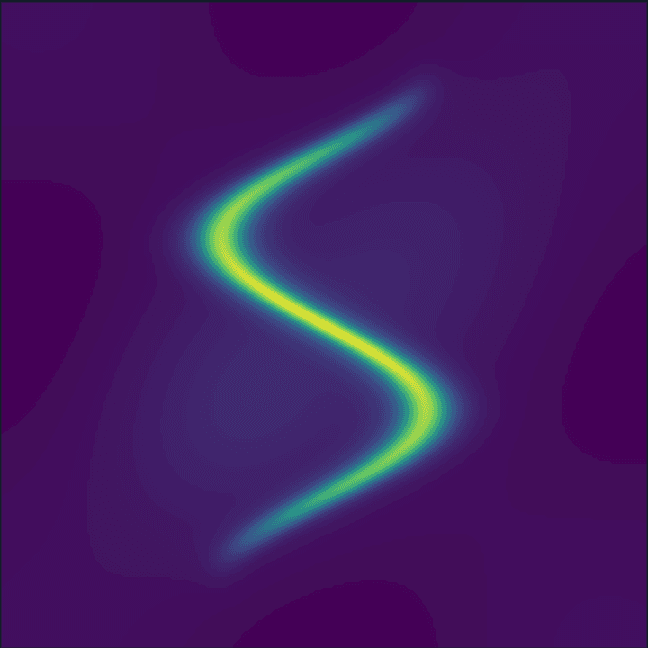
 Peak fitting
SmartPlot
- Simple
- Efficient
- Fashionable
Bilingual scientific plotting and data analysis software for researchers. Available on Windows, macOS, and Linux beta.
Plot, analyze, style, and export in one workspace.
SmartPlot is desktop software, not a web plotting tool.
SmartPlot
/set line color deep blue
/set x range 0 to 20/set line color deep blue/set font Times New Roman/add text "Order 1"/add vertical line at x=5Peak fitting Grouped bar
 Curve fitting
 Box plot
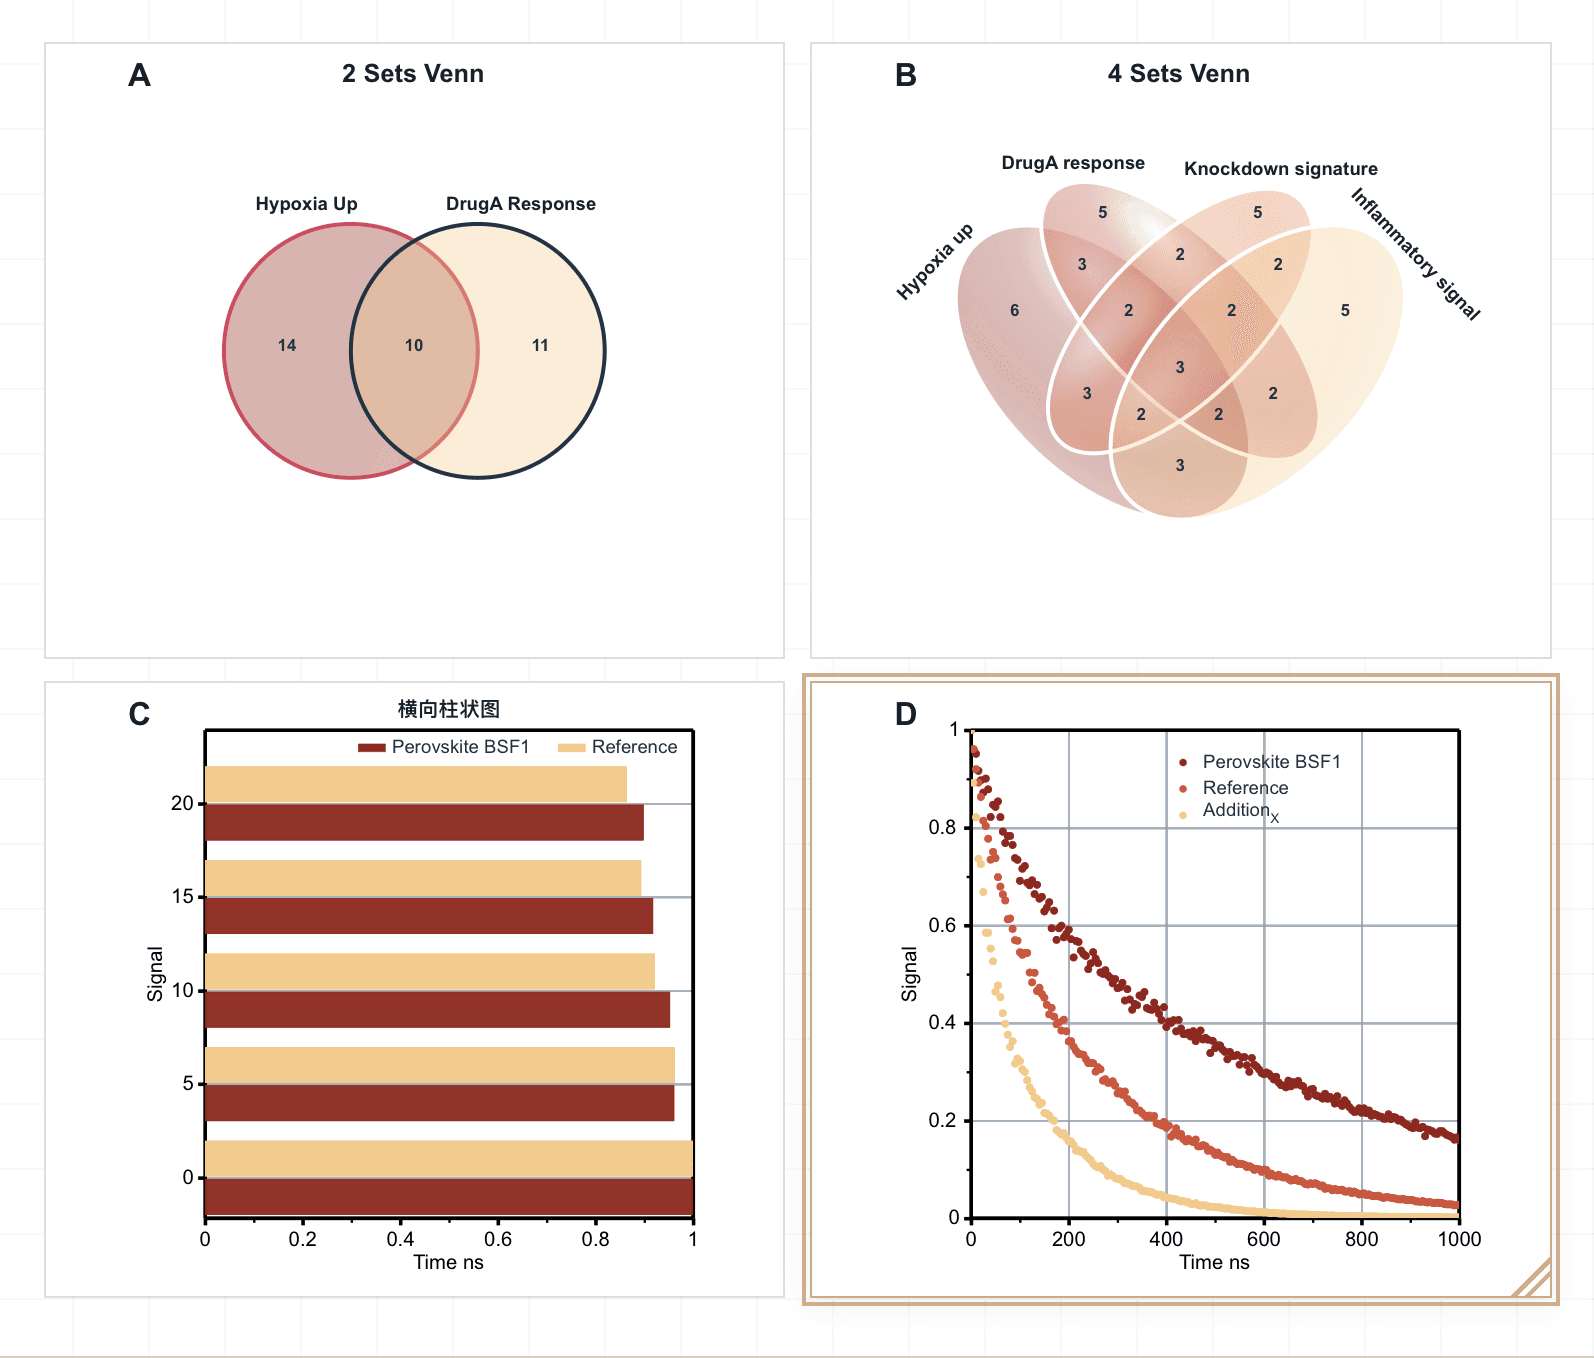
A clean showcase of common scientific plot types you can create in SmartPlot.
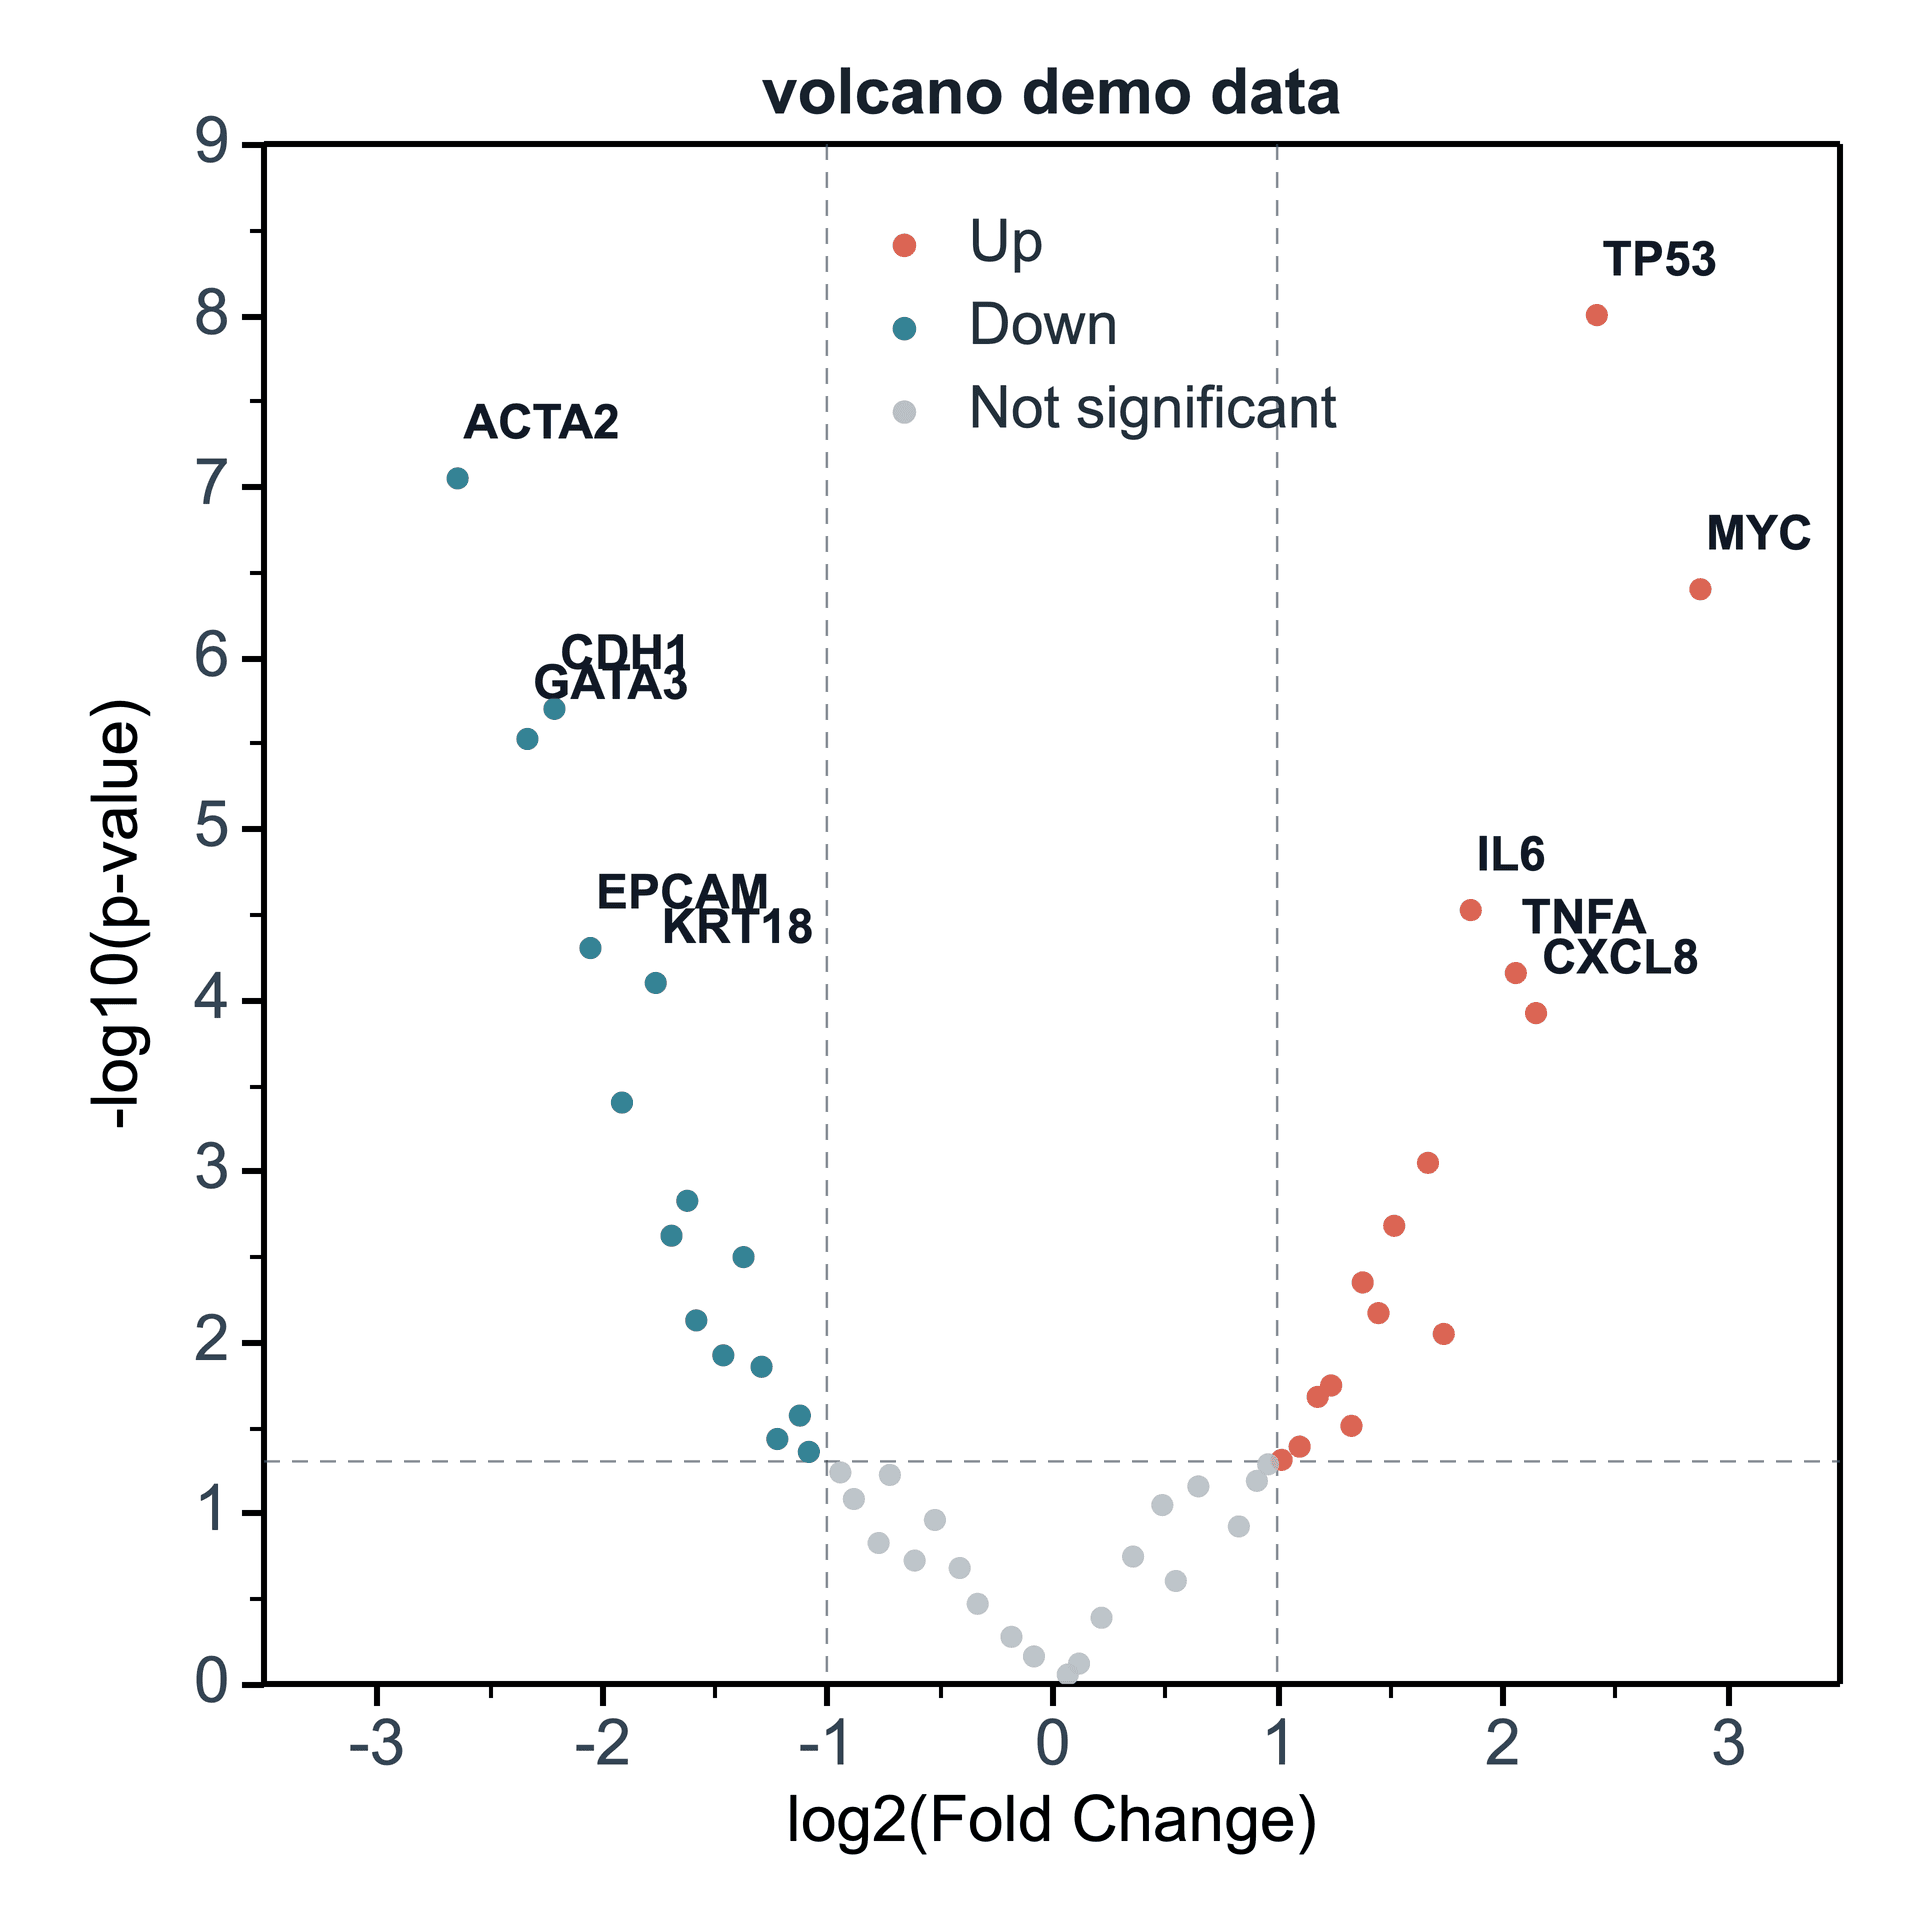
Volcano Plot
Differential analysis and significance display
View tutorial →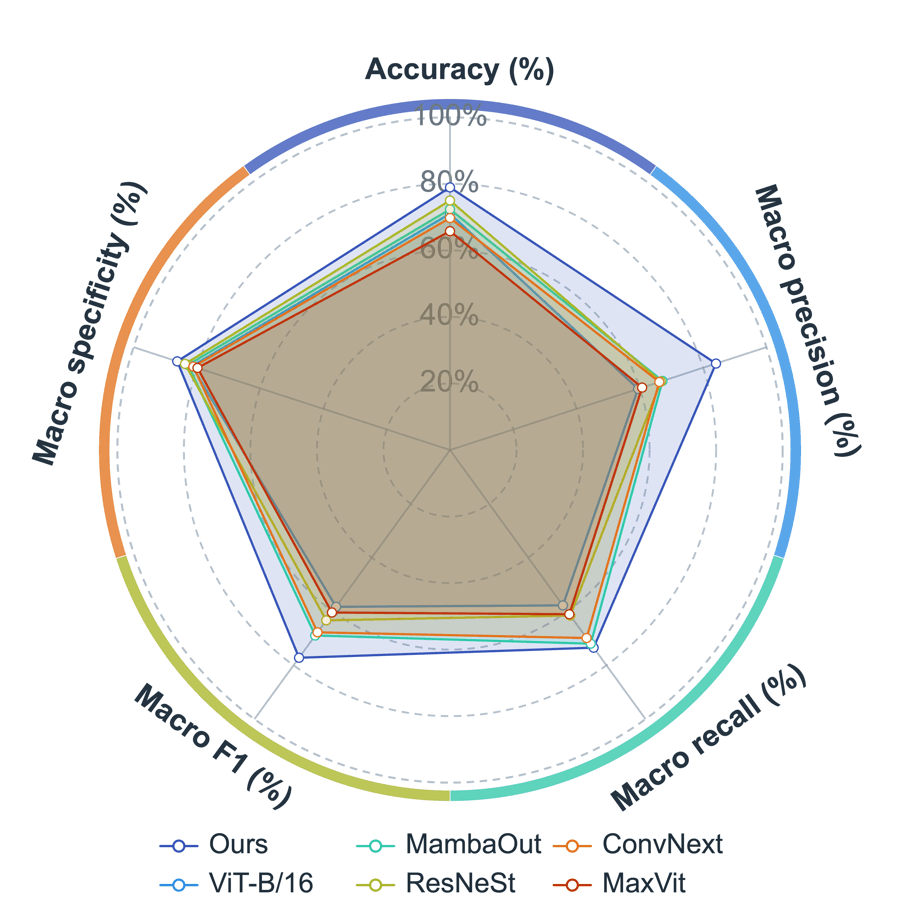
Radar Chart
Compare multiple objects across shared metrics
View tutorial →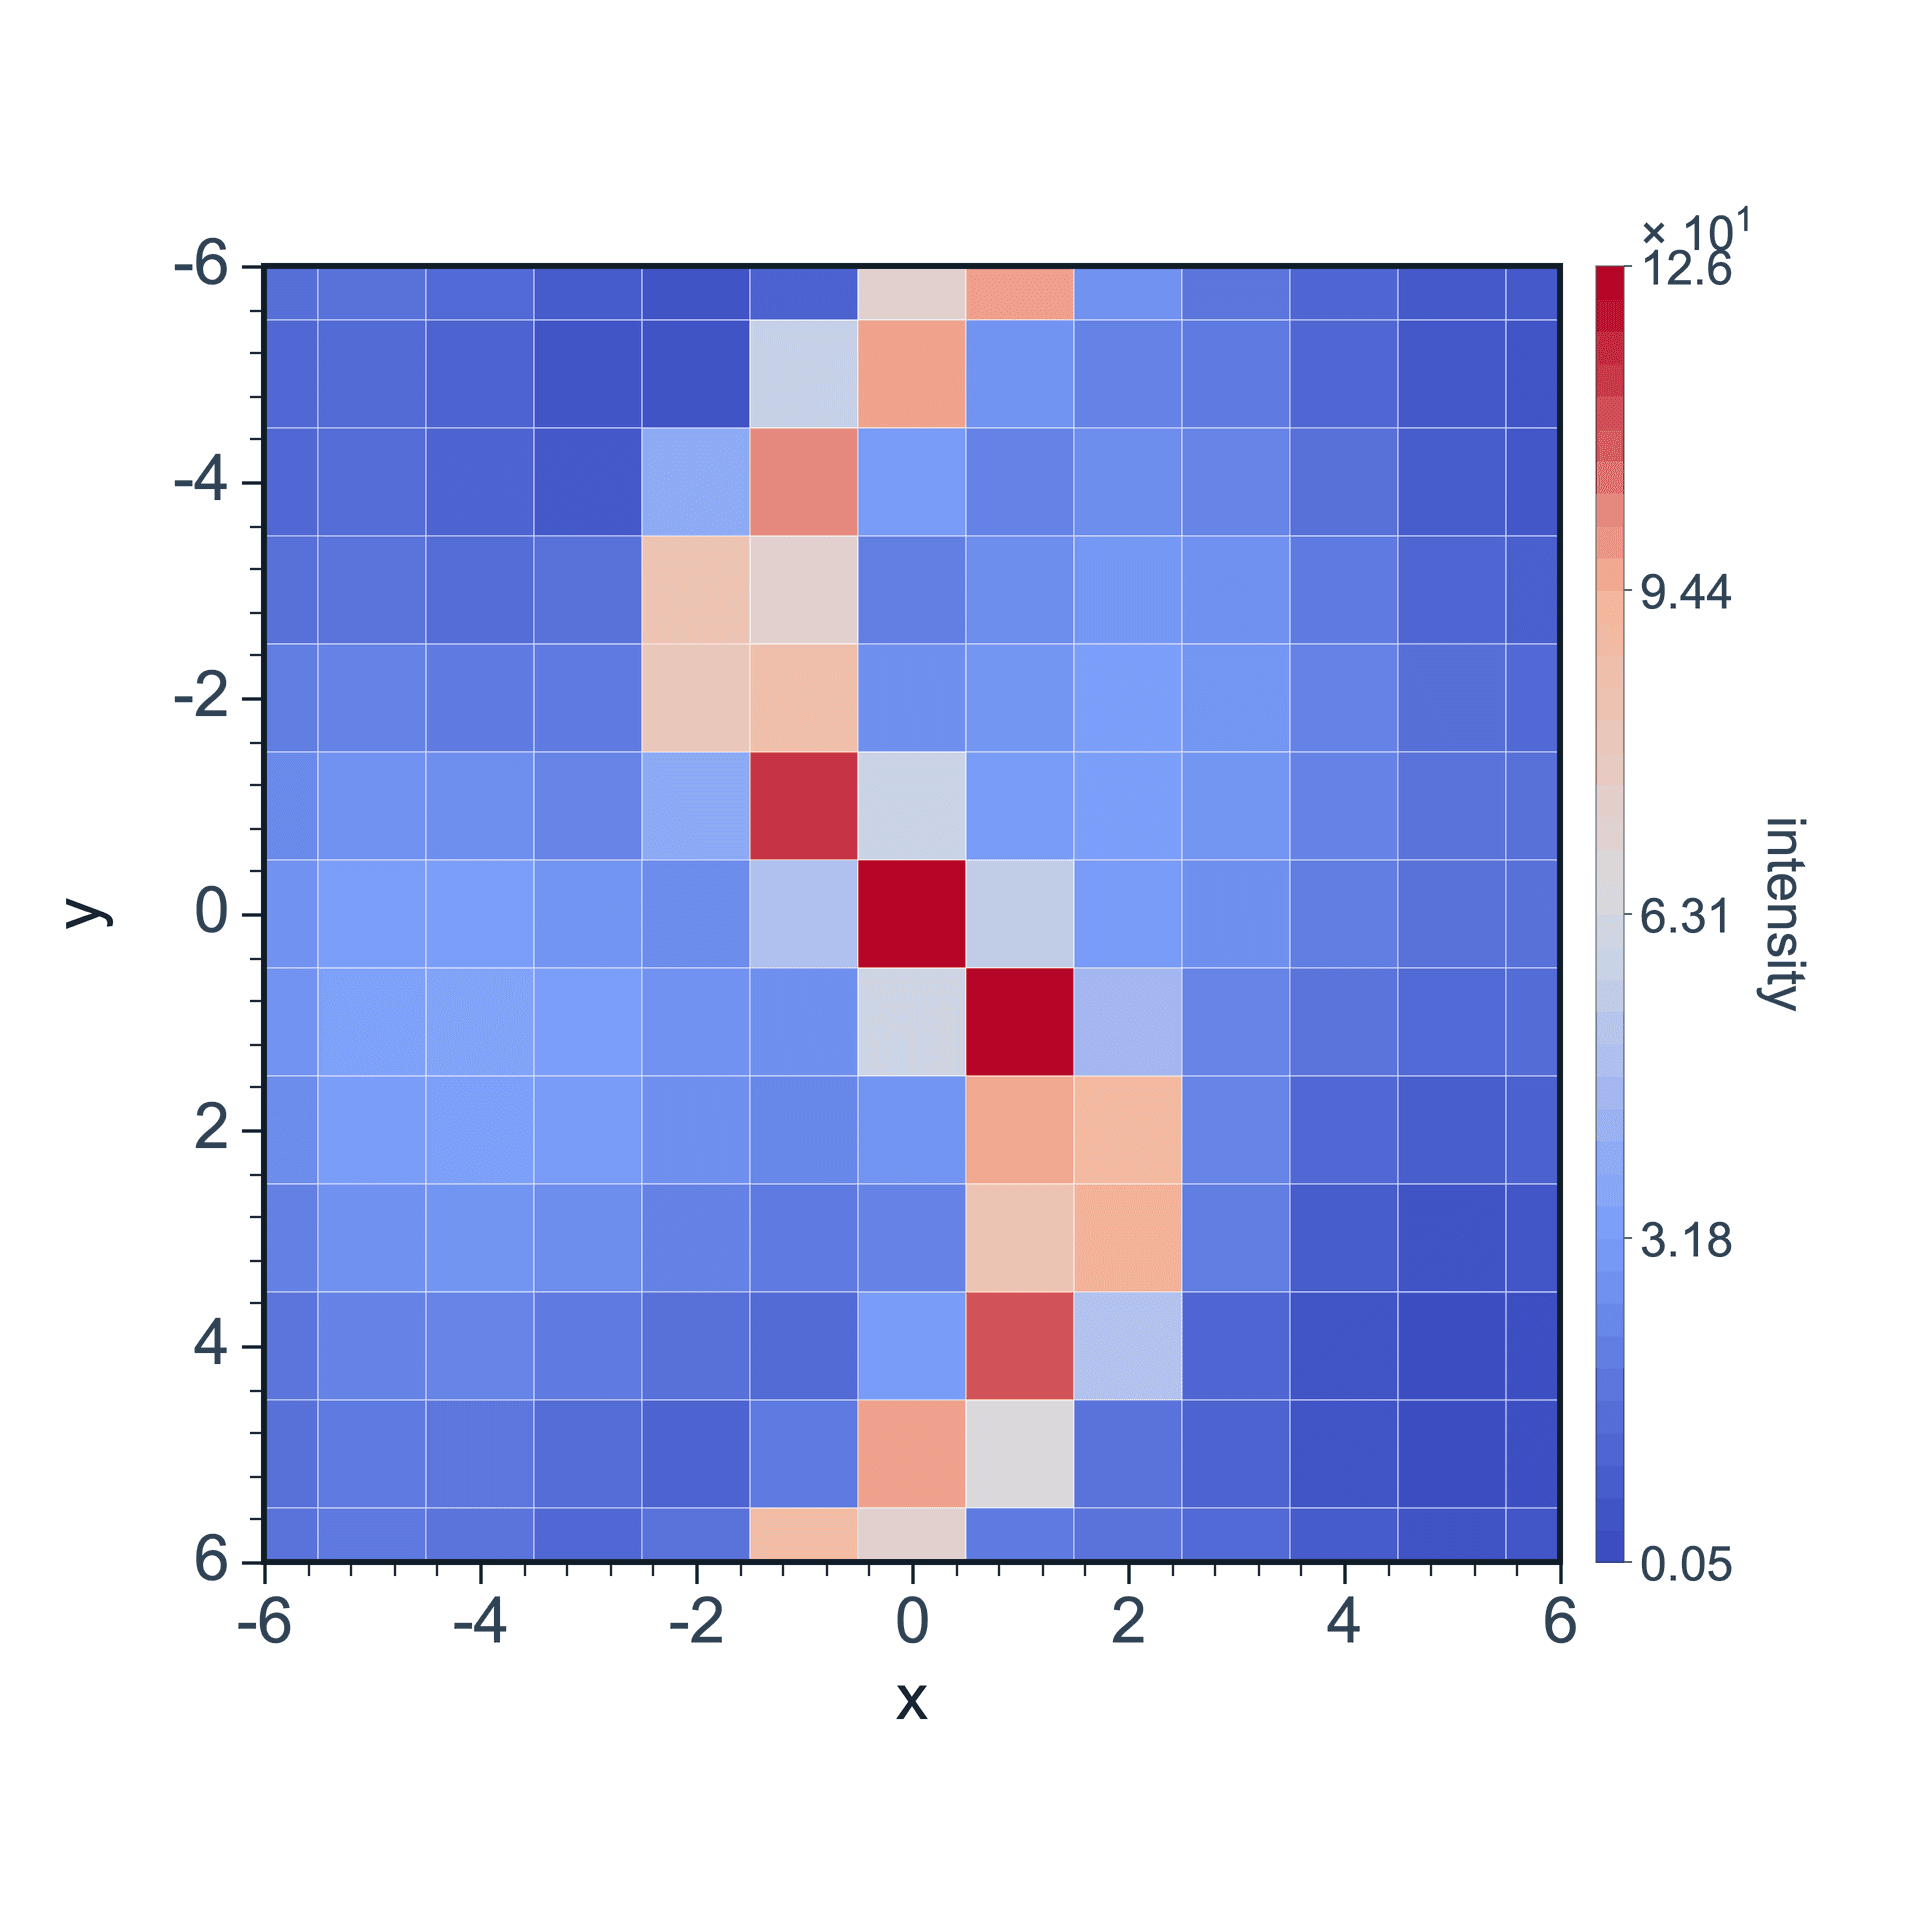
2D Color Map
Two-dimensional data mapping with color
View tutorial →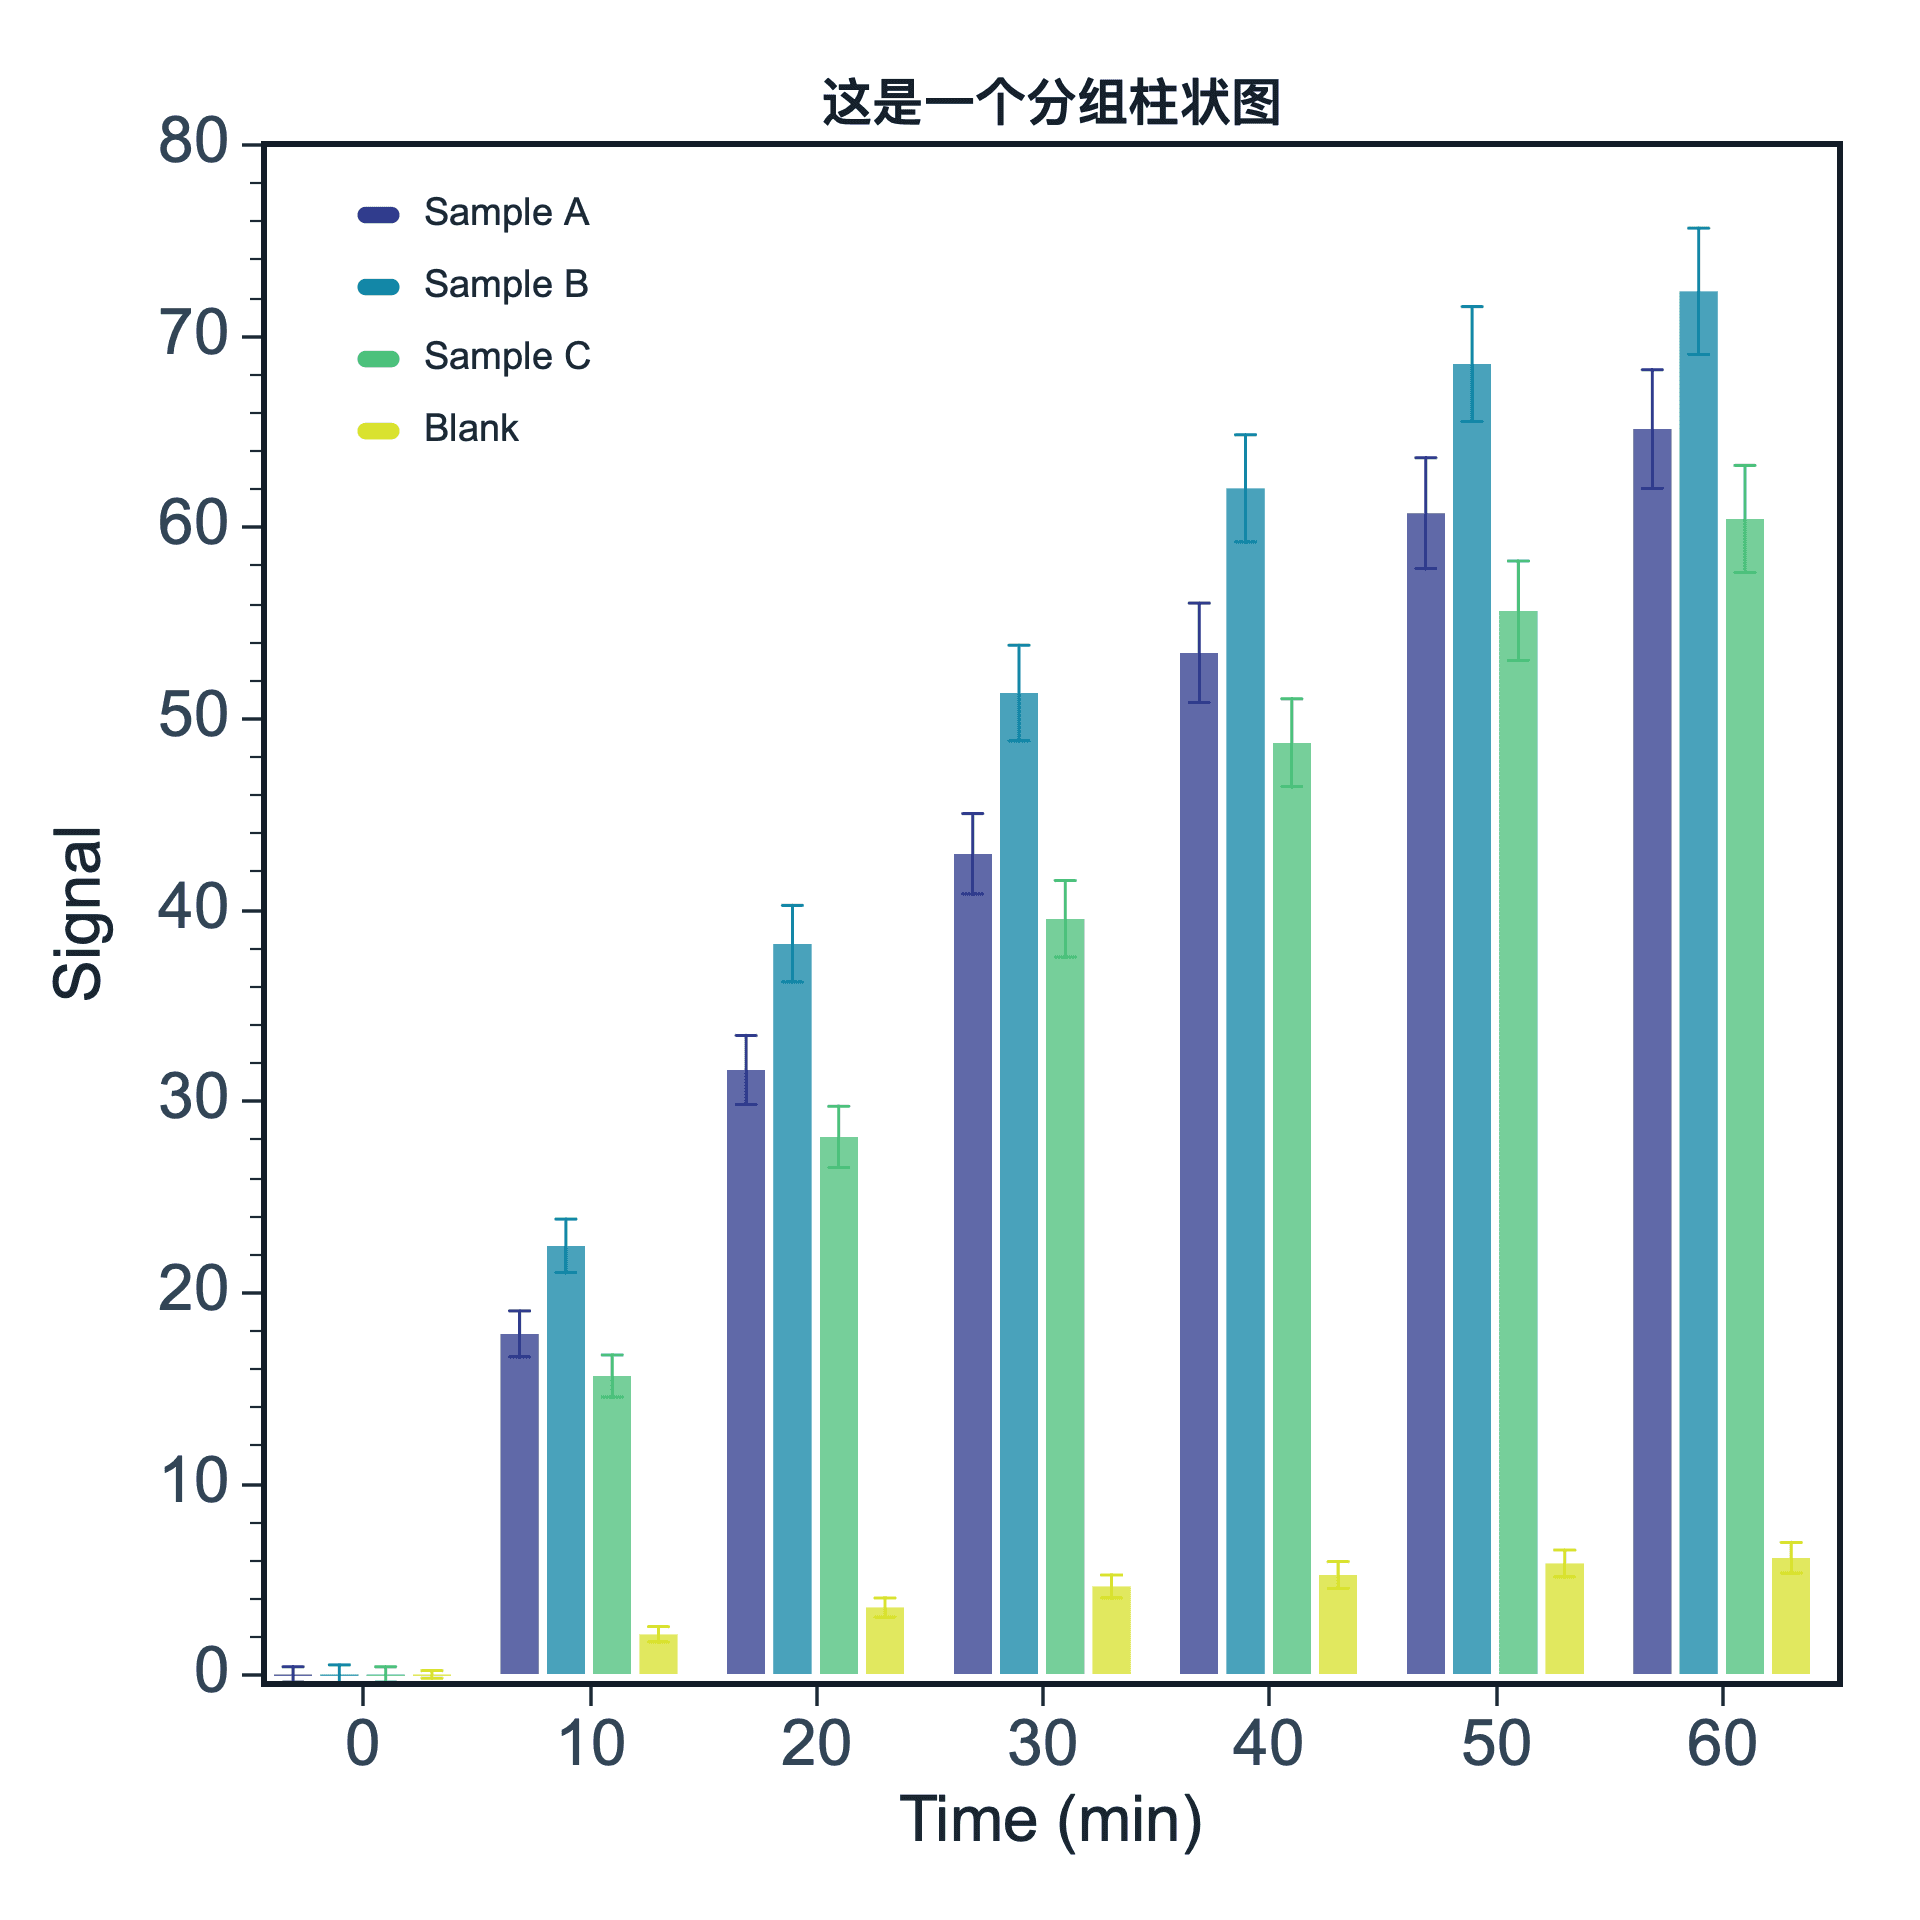
Bar Chart
Category comparison and value display
View tutorial →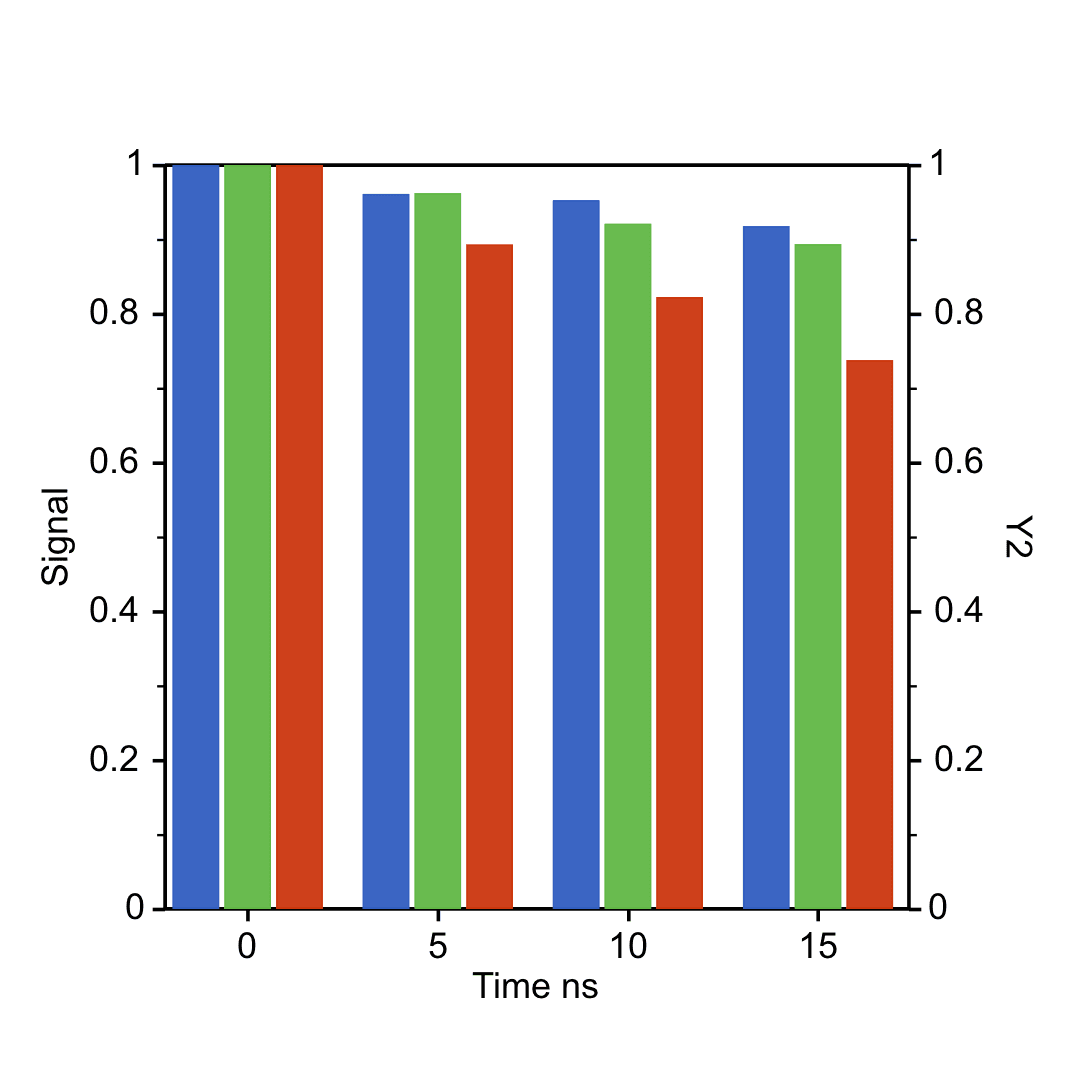
Dual Y Bar Chart
Compare categorical series across separate Y axes
View tutorial →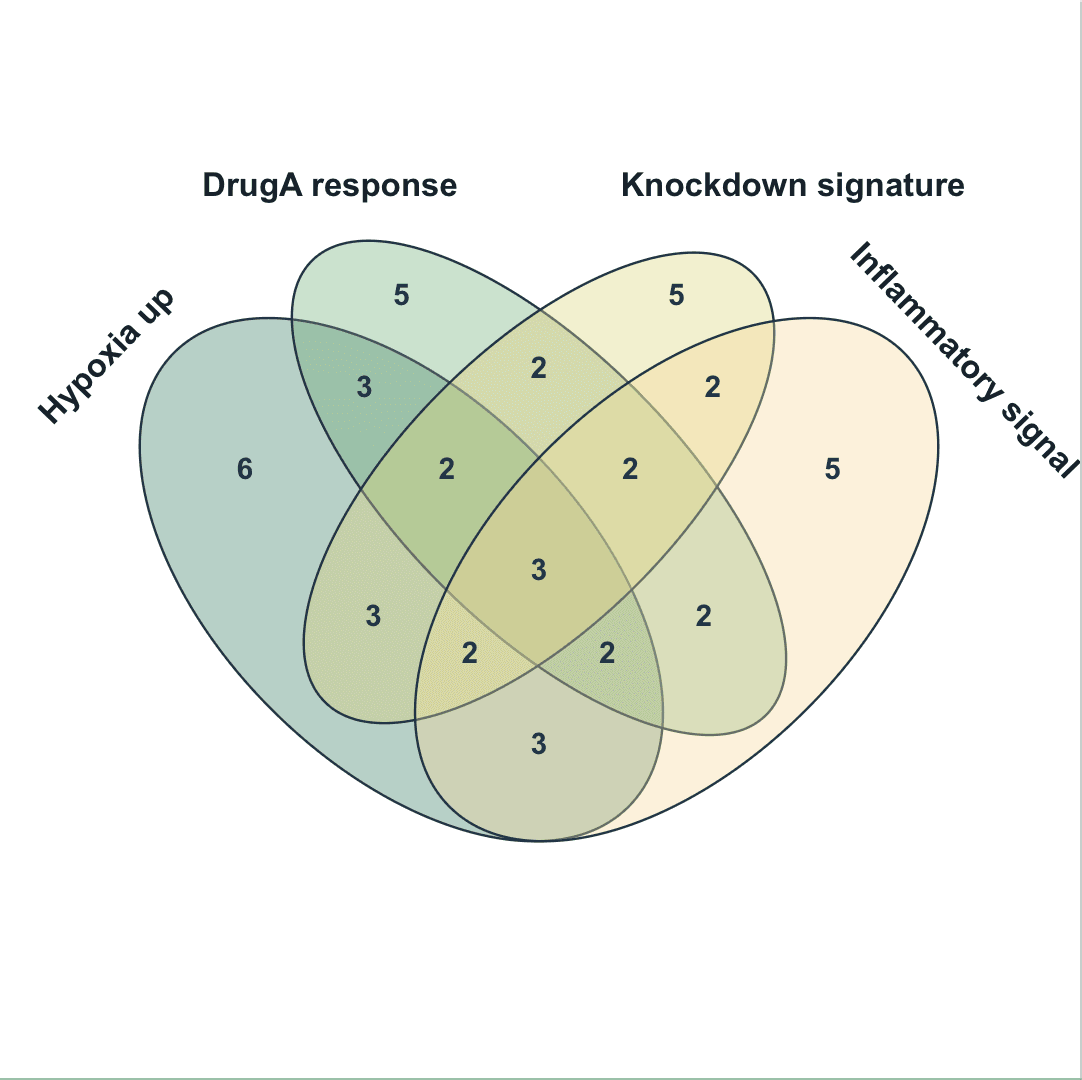
Venn Diagram
Compare intersections across 2-4 sets
View tutorial →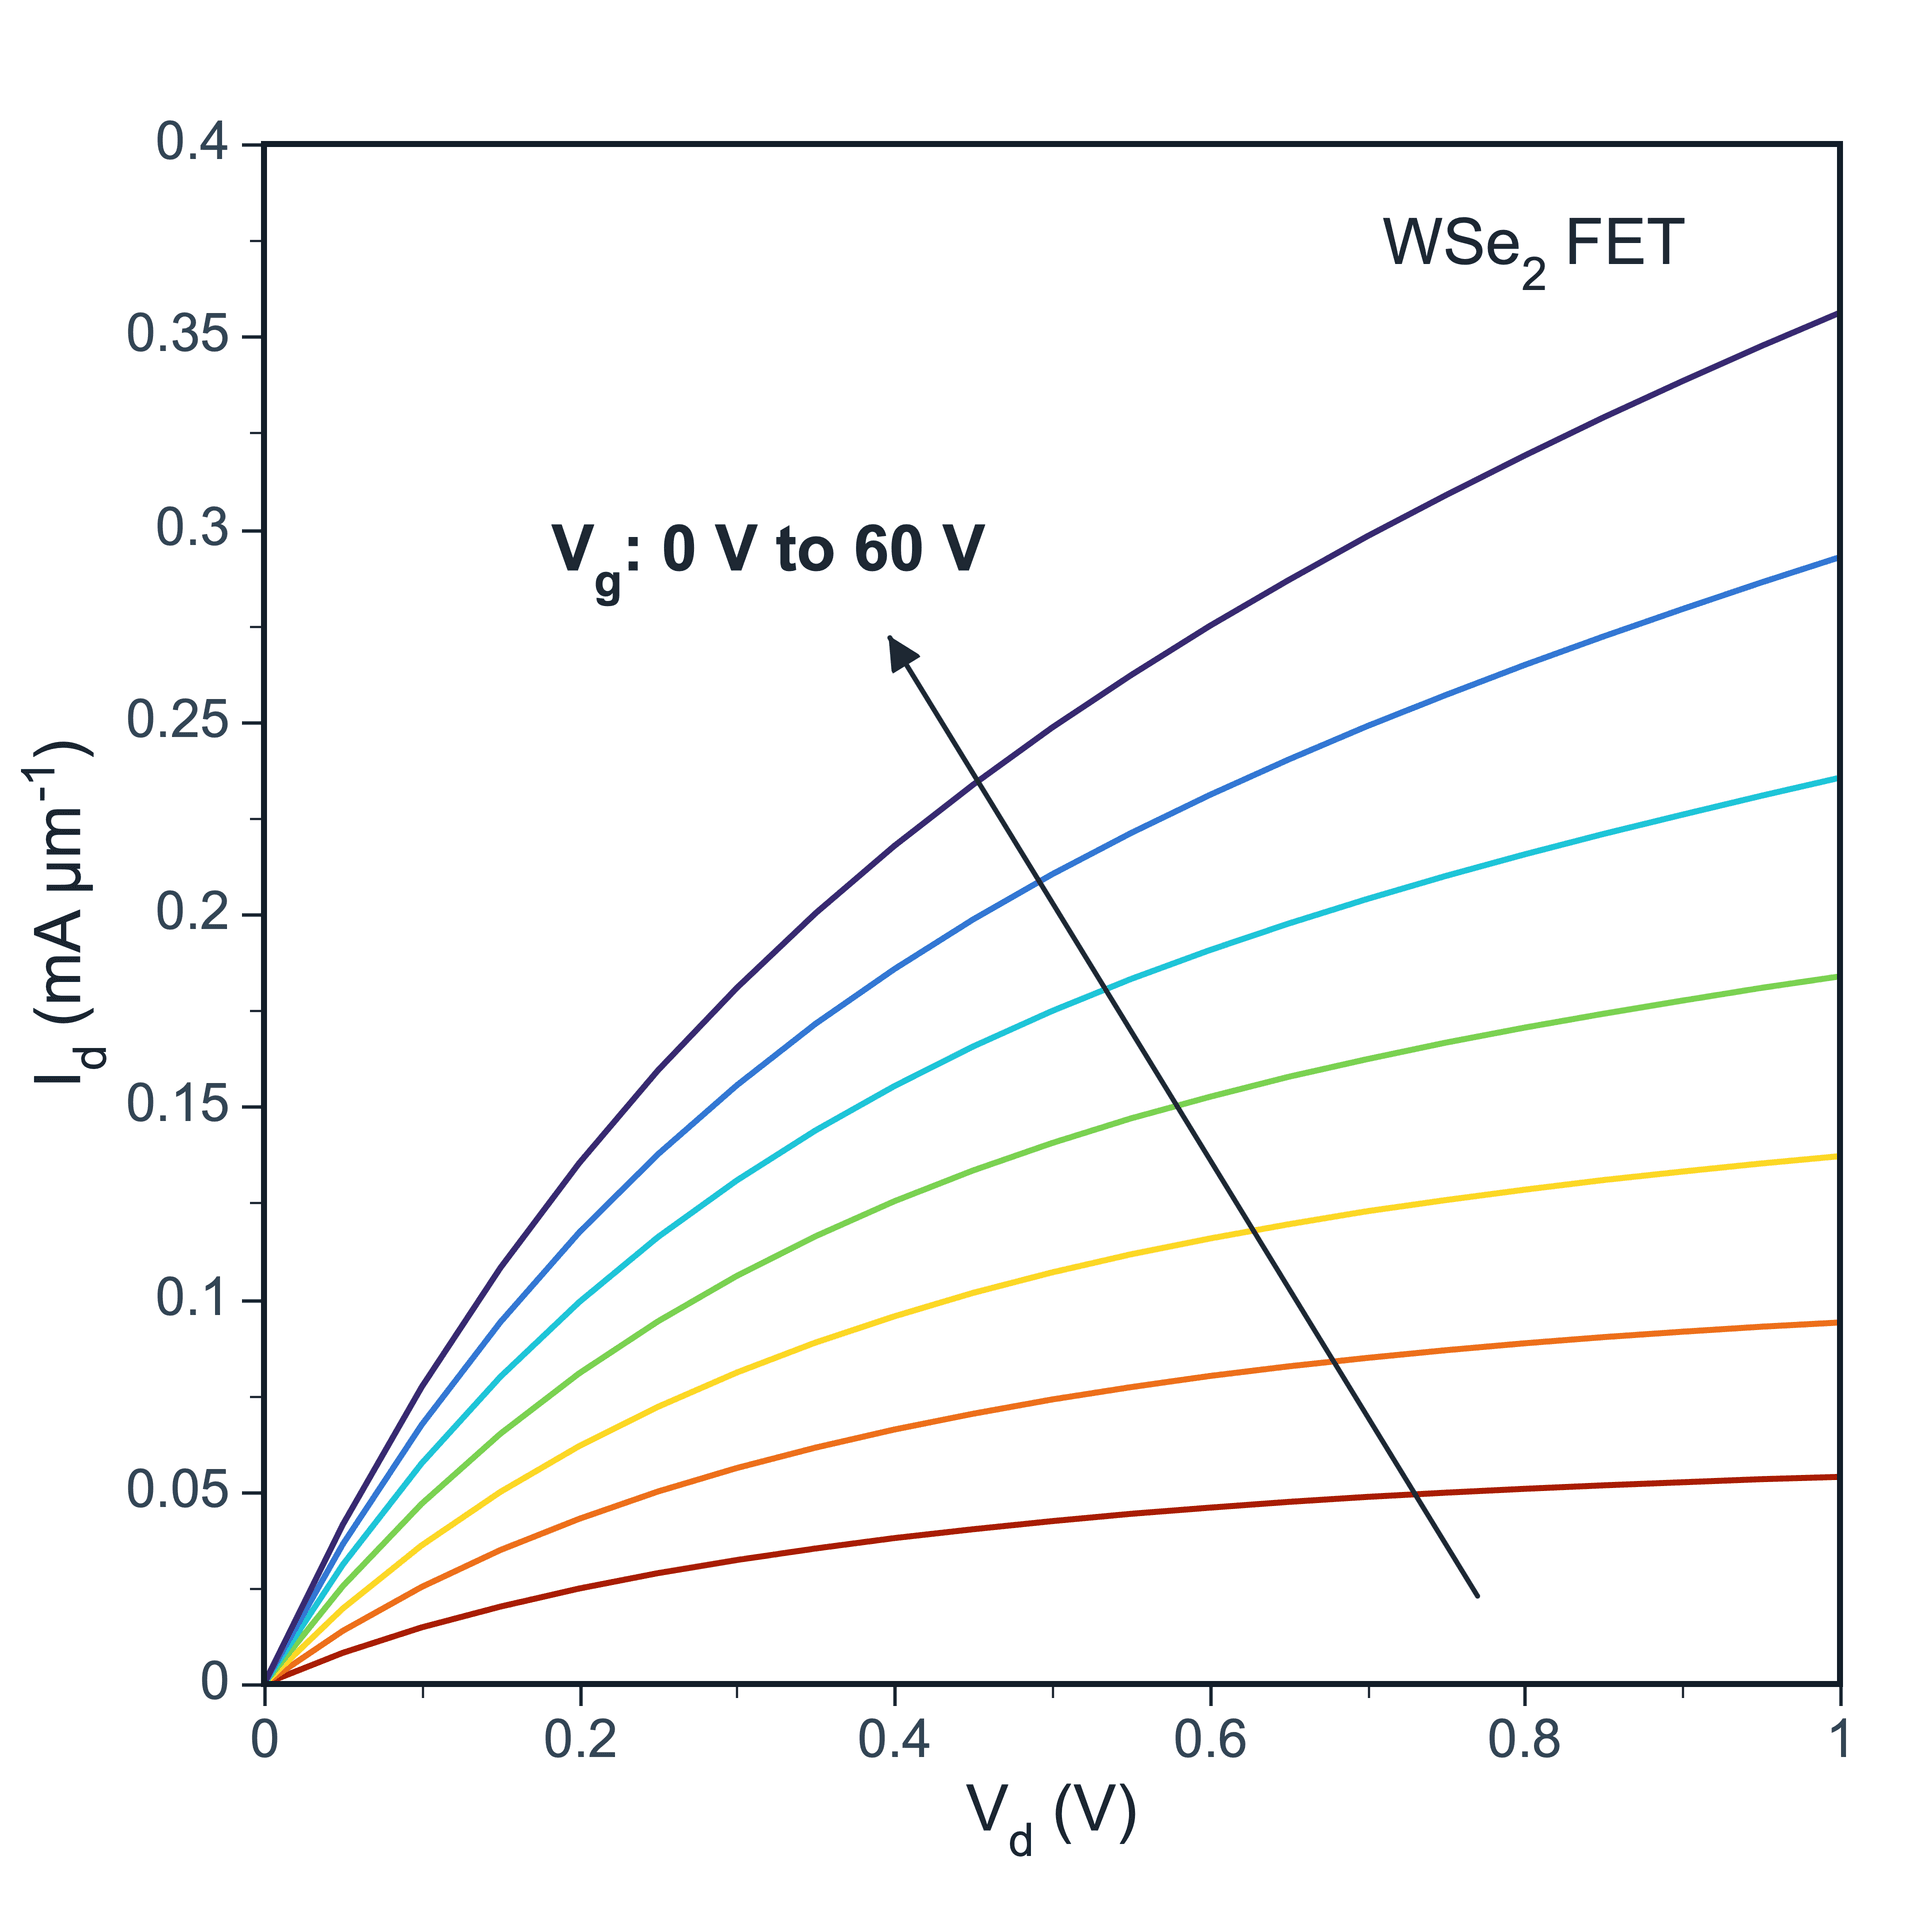
Line Plot
Multiple curves and trend display
View tutorial →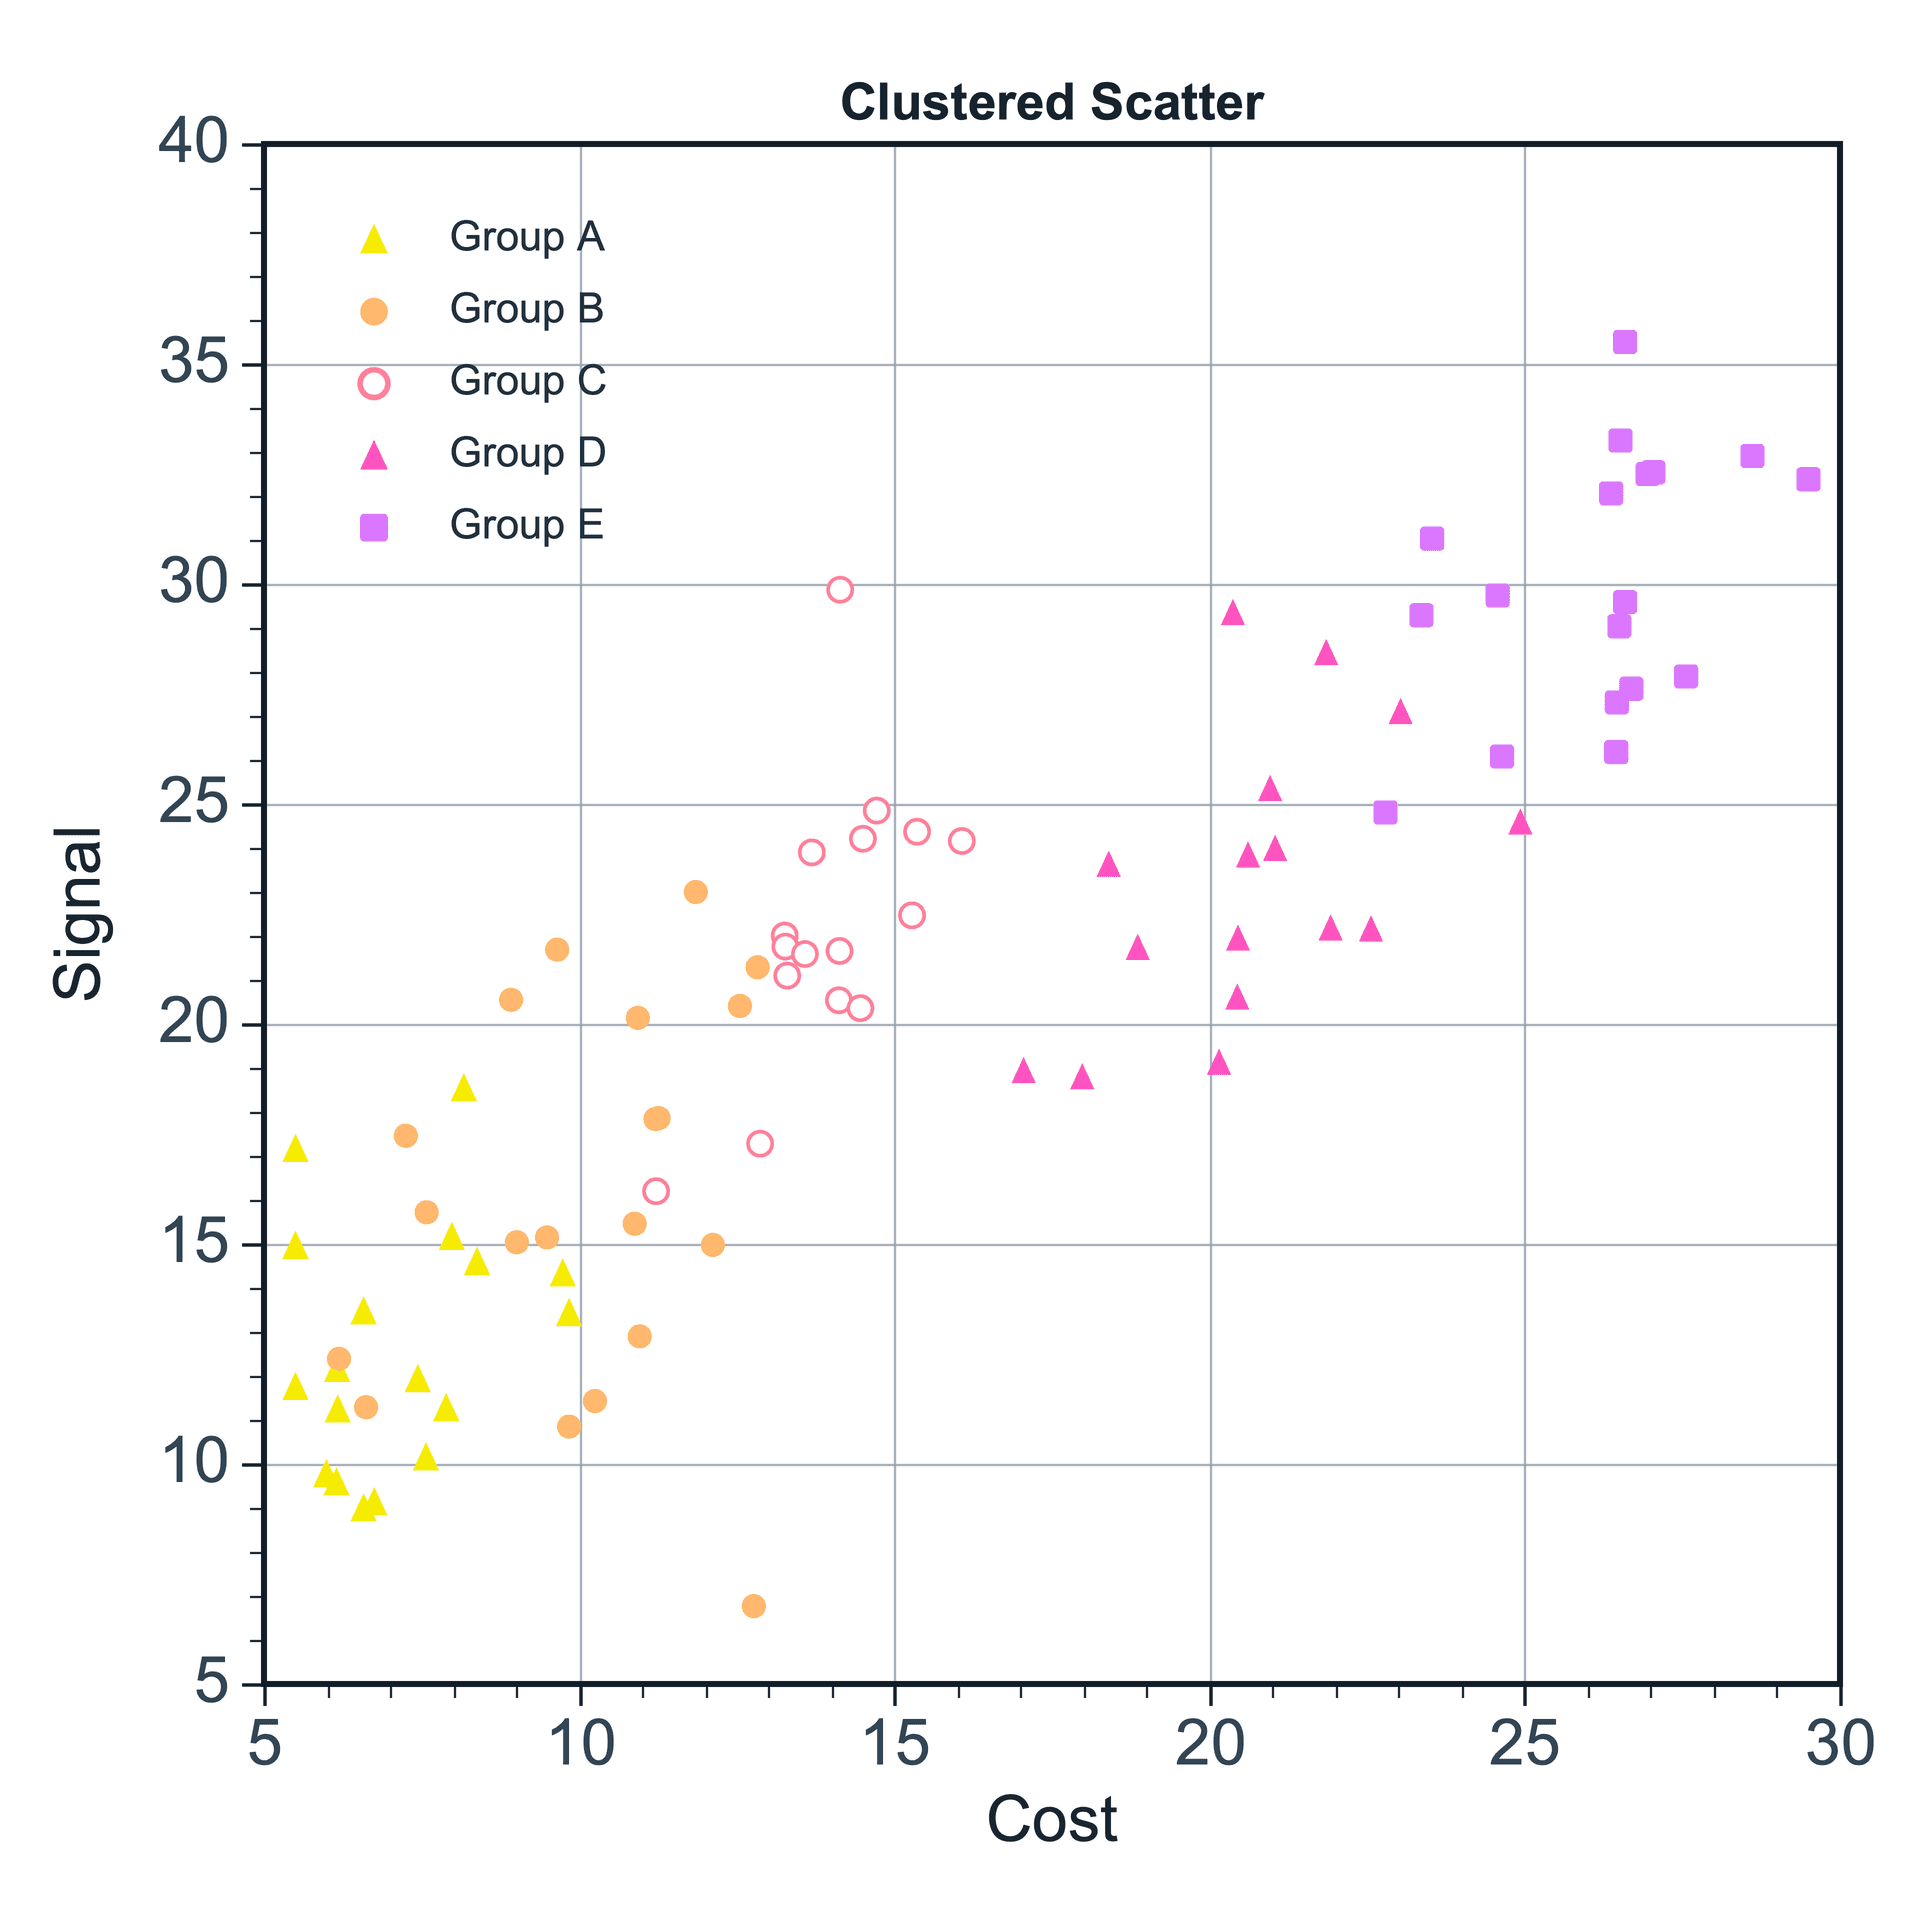
Scatter Plot
Data distribution and correlation display
View tutorial →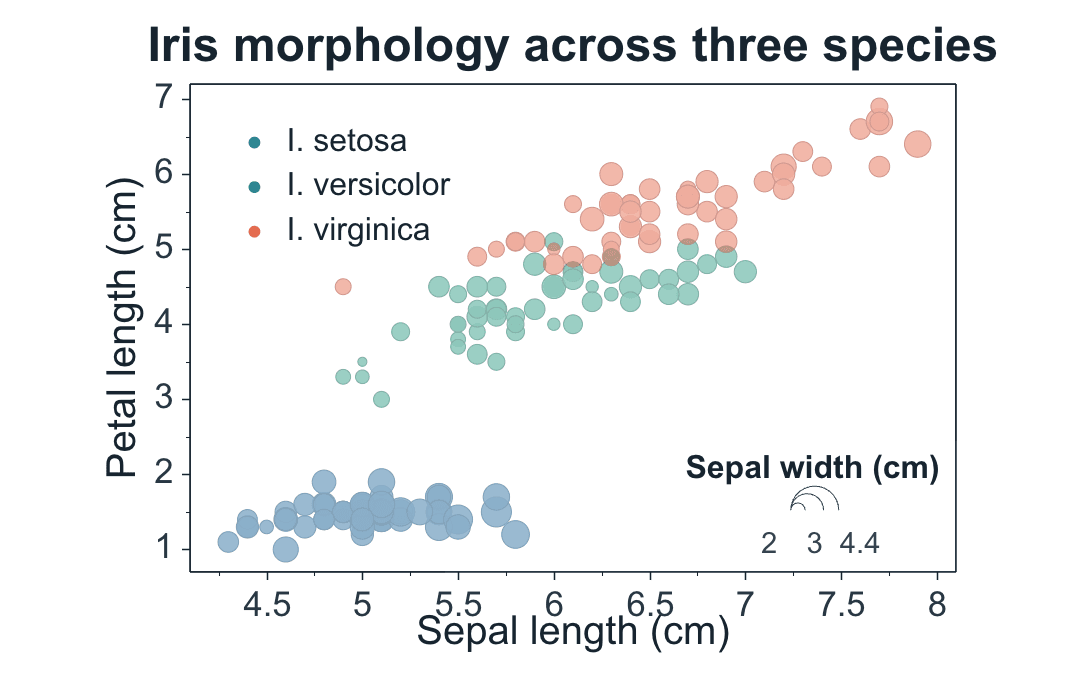
Bubble Chart
Map a third numeric variable to bubble size
View tutorial →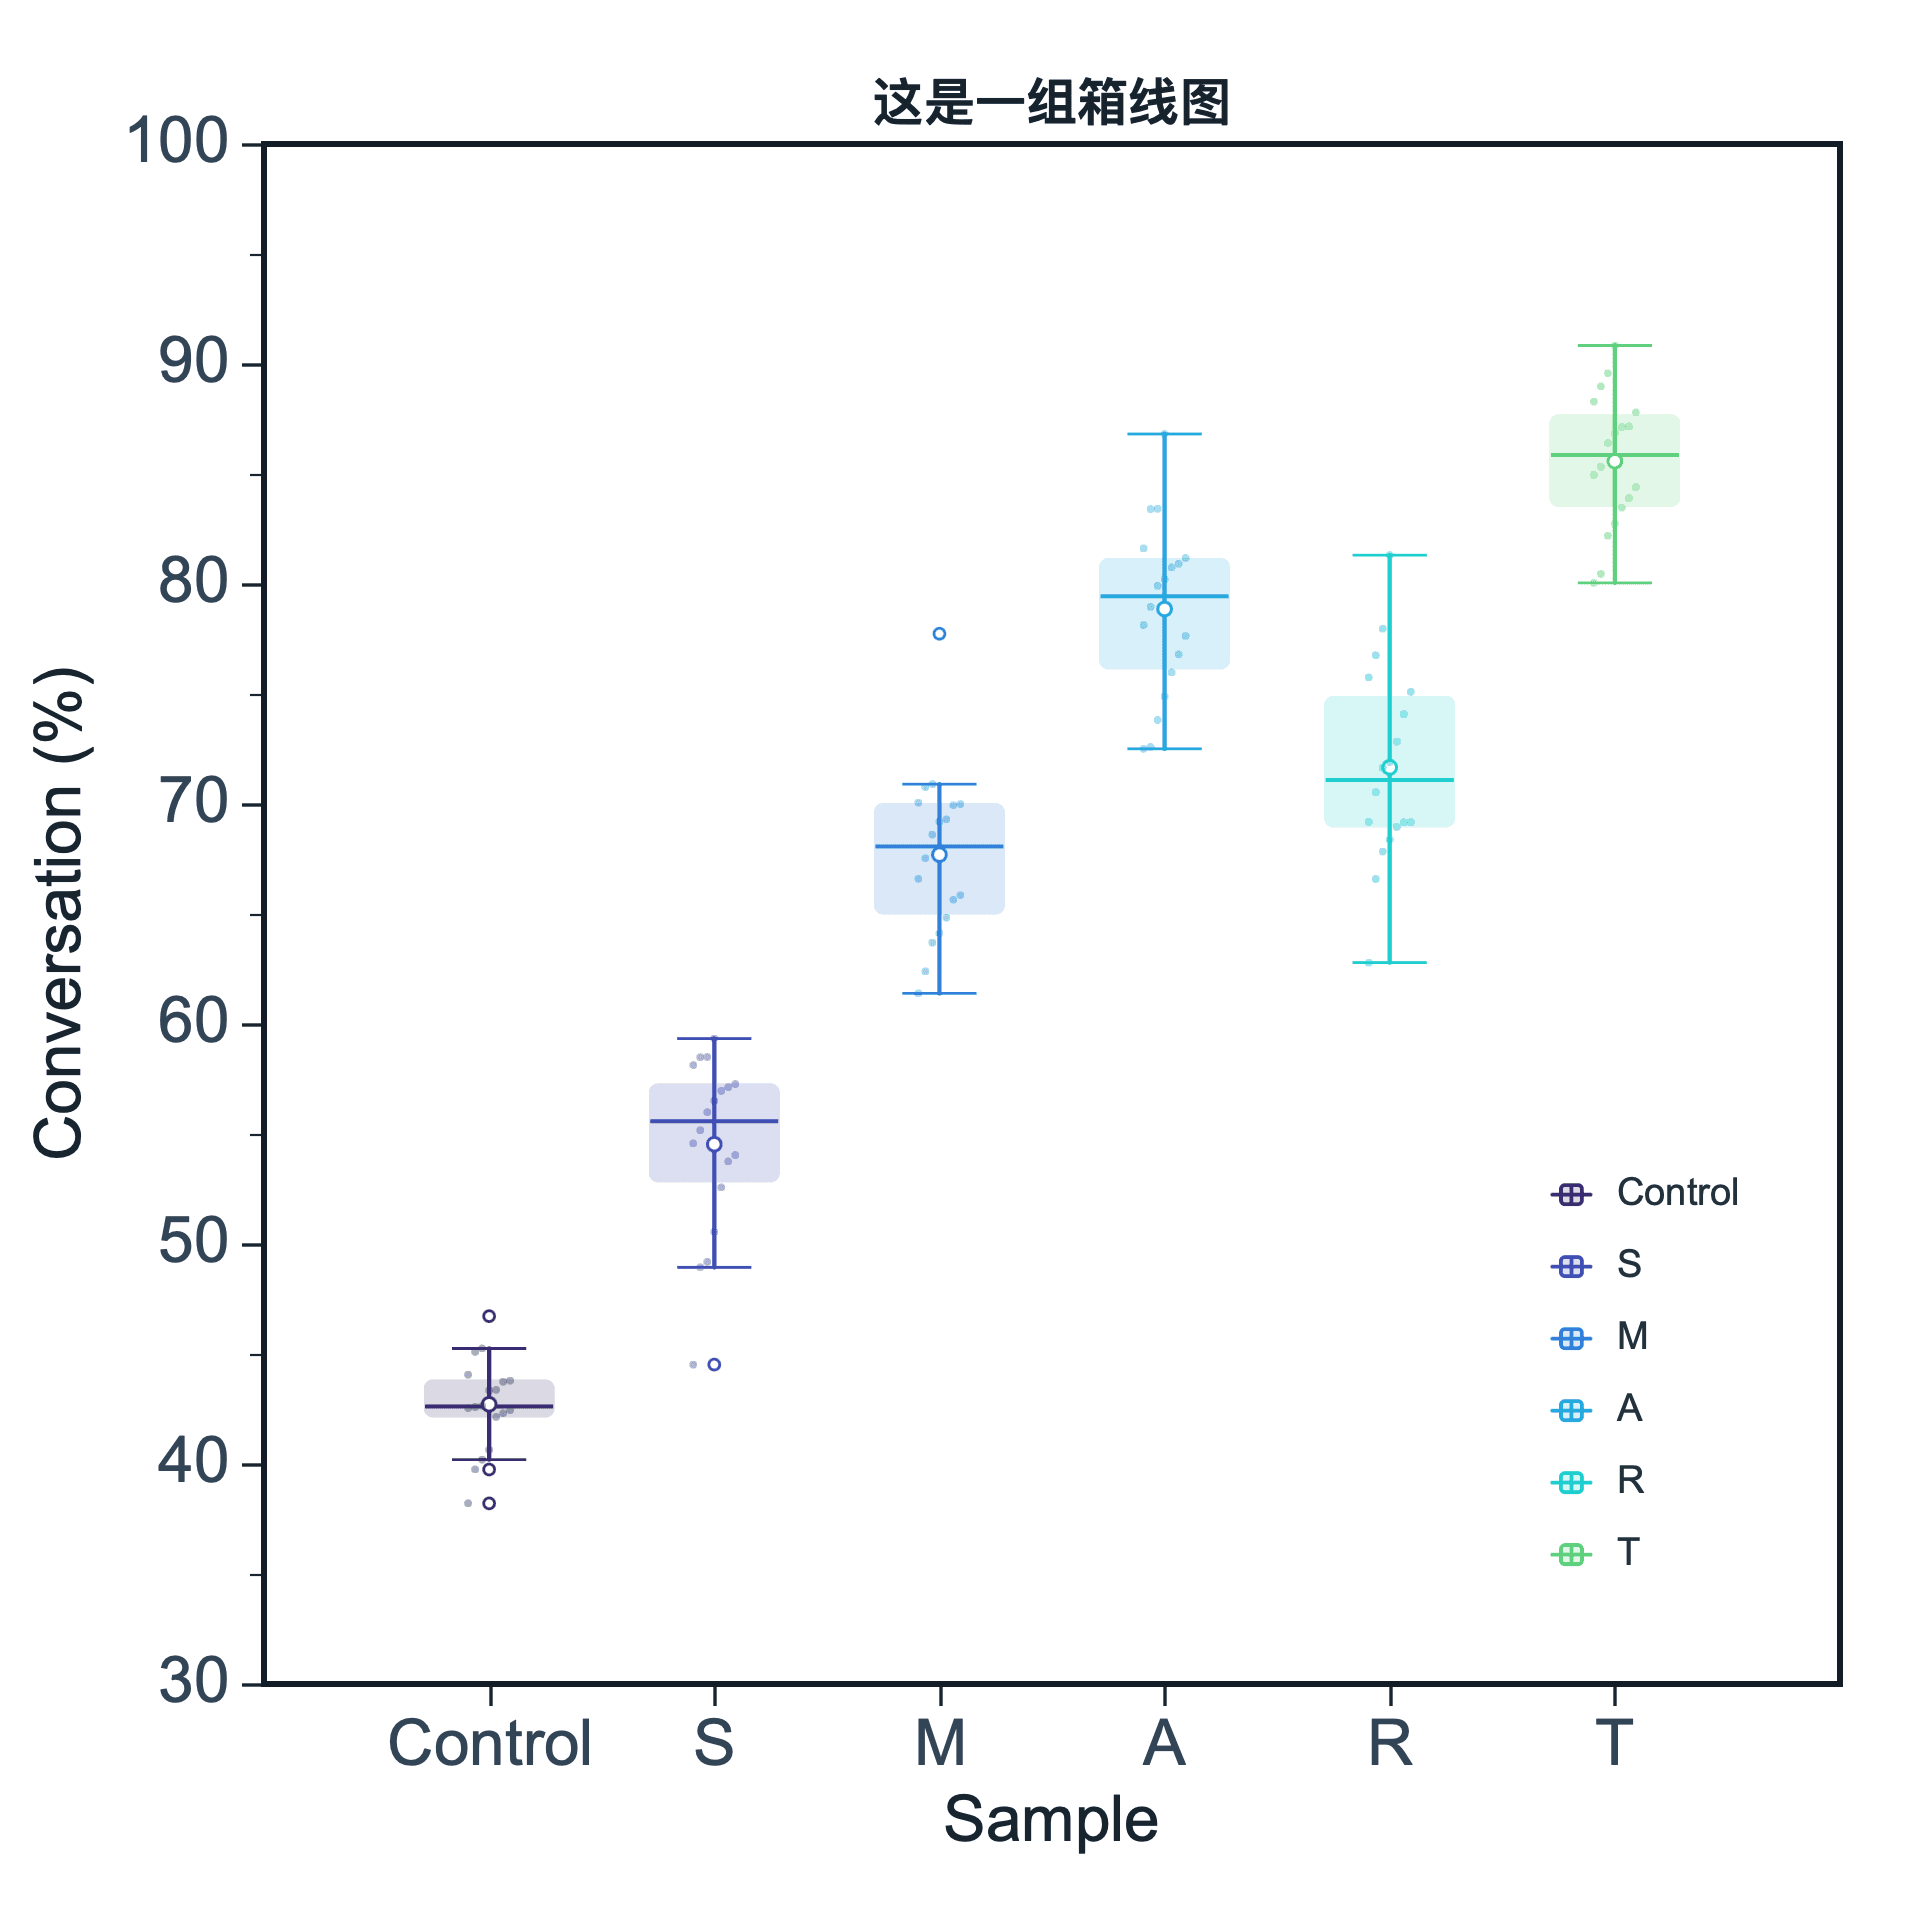
Box Plot
Statistical distribution and group comparison
View tutorial →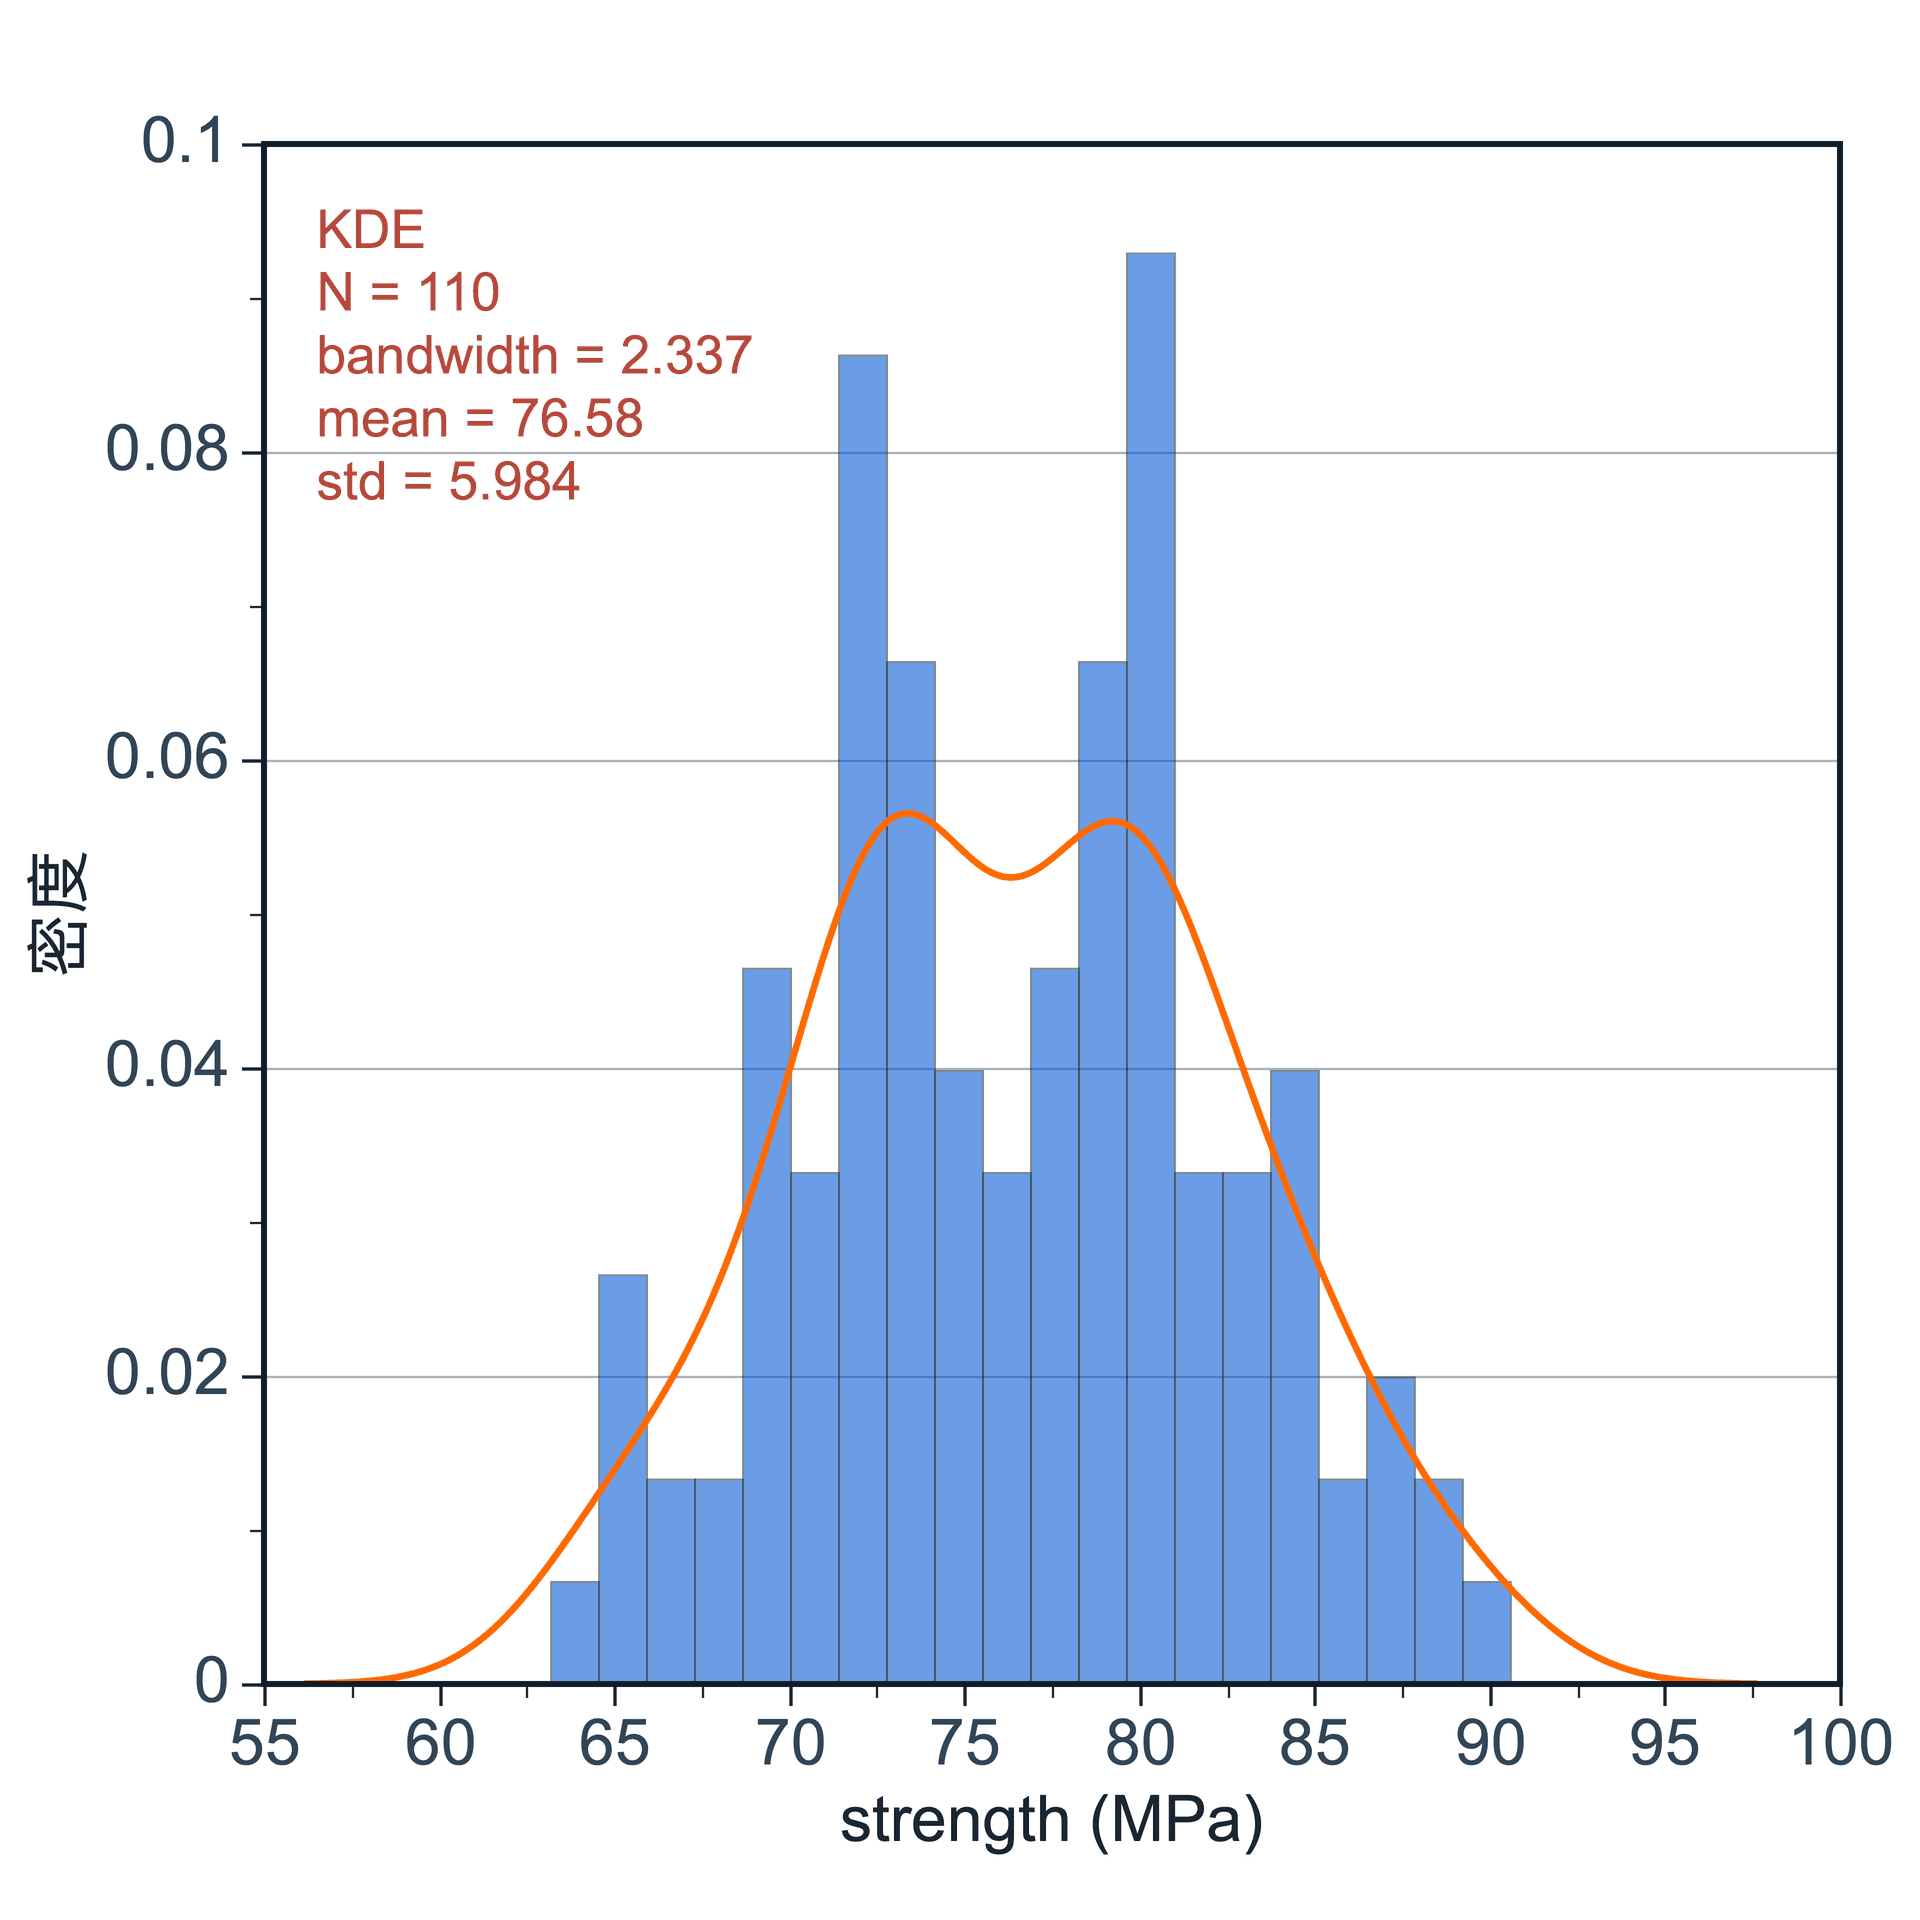
Histogram
Frequency distribution display
View tutorial →From data to polished figures
Start with your data table, then create, style, and export your plots step by step.
Data Import & Projects
Import CSV, TXT, and other data files, open or save SmartPlot projects, and manage multiple data tables.
View tutorial →Data Editing & Column Roles
Set column names, column roles, data types, and number formats. Work with selections, sorting, generated data, and cleanup tools.
View tutorial →Analysis & Fitting
Run baseline correction, Shirley background subtraction, peak fitting, trend fitting, smoothing, derivative, and integration.
View tutorial →Styling & Layout
Adjust color palettes, lines, axes, legends, fonts, markers, and overall figure themes.
View tutorial →Annotations & Guides
Add text, reference lines, shapes, labels, arrows, and annotations to make figures easier to understand.
View tutorial →Export & Save
Export figures as images, vector graphics, or PDF files, and save projects for later editing.
View tutorial →Draw plots first. One-click composition after.
SmartPlot Composer turns finished plots into a publication-ready multi-panel figure with ordering, auto labels, alignment, style unification, and whole-figure export.
Compact modeDrag the brush left or right to compare both layouts.
 Compact modeIndependent panels
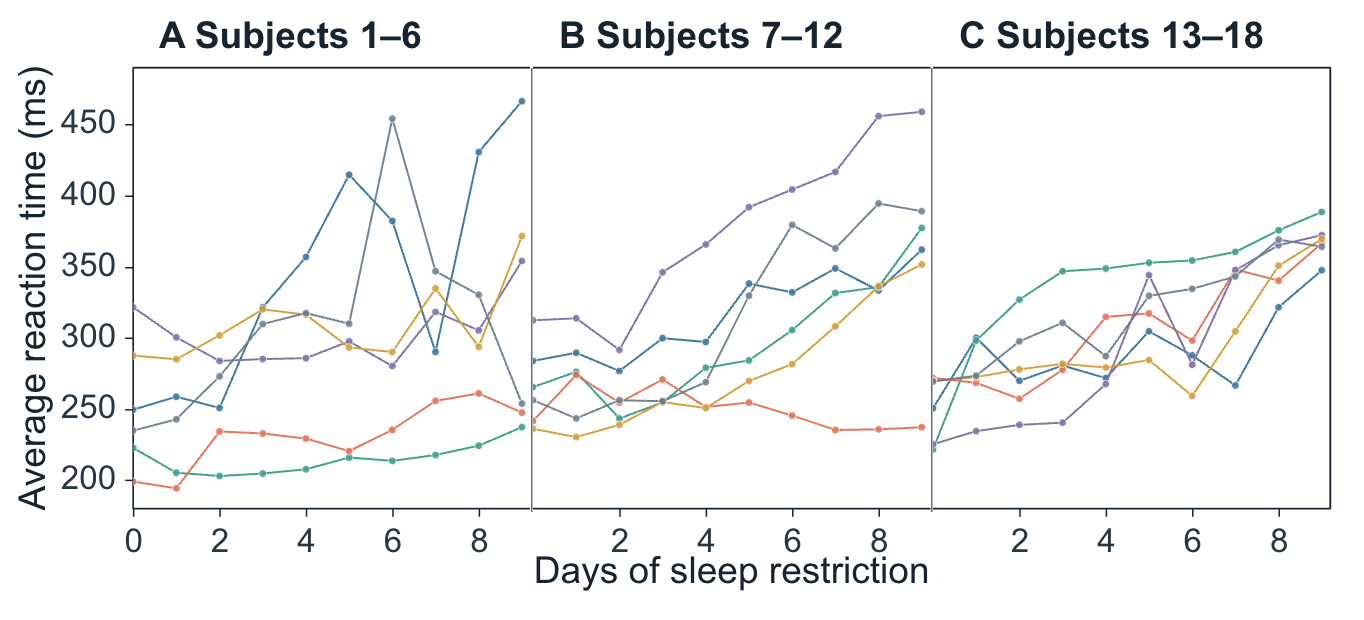
SMARTPLOT INTELLIGENCE
One intelligent workspace, two ways to work.
Type commands directly in SmartPlot, or let compatible AI clients understand the active workspace and plan a complete workflow through MCP.
SmartPlot Command Demo
Start free. Go further with Plus.
SmartPlot Free covers everyday scientific plotting, data organization, and basic analysis;
Plus adds more templates, palettes, and batch-processing tools to make repeated tasks easier.
SmartPlot Free
- ✓Available on Windows and macOS
- ✓Data import, organization, and plotting
- ✓Common scientific plot creation
- ✓Figure styling and export
- ✓Basic Smart Command Panel
Early supporter planCelebrating 200+ Plus users
SmartPlot Plus
$5
One-time purchase$35 / year
- ✓Everything in Free
- ✓Reusable plot templates
- ✓Saved data-processing workflows
- ✓More efficient batch-processing experience
- ✓Priority access to future Plus features
- ✓1 License supports up to 3 active devices at the same time
Payment is settled in USD. Bank cards and WeChat Pay are supported at checkout.
After purchase, you will receive a SmartPlot Plus License Key and activate Plus inside SmartPlot.
FAQ
A few honest answers about the product direction, the Free version, Plus, and how SmartPlot is meant to grow.
What is the idea behind SmartPlot?
SmartPlot is for researchers who want scientific figures to be easier to make, easier to polish, and nicer to look at. It focuses on the real plotting workflow: clear layouts, comfortable data styles, smoother export, and fewer small steps between raw data and a figure you are ready to share.
Will the Free version disappear later?
No. Free will stay useful for everyday plotting, data organization, basic analysis, styling, and export. Plus is not about taking the basics away. It is where we put richer visual styles, more palettes and gradients, reusable templates, saved workflows, and batch-oriented tools.
Why does SmartPlot have a Plus version?
Good scientific plotting software needs ongoing design, testing, documentation, compatibility work, and user support. Plus helps fund that work while giving paying users more polished and efficient tools: richer styles, template operations, workflow reuse, and features that make repeated figure work feel simpler.
What is the practical difference between Free and Plus?
Free is for making common scientific plots cleanly. Plus is for users who care more about visual polish and repeatable workflows: more color and data styles, gradient palettes, reusable figure templates, saved analysis/export flows, and faster handling of similar datasets.
Does SmartPlot work on both Windows and macOS?
Yes. SmartPlot supports Windows and macOS, and Linux beta builds are now open for testing. We pay special attention to the Mac experience because many research users work there, while keeping the same figure workflow consistent across platforms.
Is SmartPlot a web app?
No. SmartPlot is desktop software. The website is for download, tutorials, pricing, and support. Your actual plotting workflow happens in the installed app, which makes it easier to work with local research data and desktop files.
Will there be templates, examples, or a user community?
Yes, that is part of the roadmap. We want templates and real examples to grow carefully instead of becoming a noisy gallery. The plan is to start with practical tutorial templates, then expand toward sharing useful figure styles and workflows from real research scenarios.
Discussion
Questions are welcome here.
For usage questions, bug reports, Plus feedback, or feature ideas, join a group that works best for you.

Most Chinese discussion happens on REDnote.
Xiaohongshu / REDnote
Scan to join Xiaohongshu / REDnote
Also available
QQ Channel
Scan to join QQ Channel
Also available
Discord
Scan to join DiscordStart plotting with SmartPlot.
Download SmartPlot and start creating clean scientific figures on Windows, macOS, or Linux beta.
Download SmartPlot